AI Cheats for Easy Time Series Plots
14:14
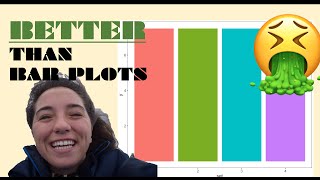
Better than bar plots: Custom point ranges in ggplot2
12:37
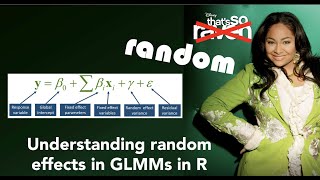
Having Fun with Random Effects in Mixed Models (GLMMs)
39:58
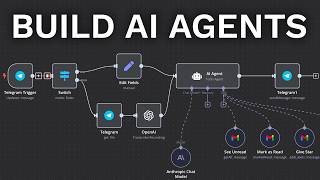
Crie tudo com agentes de IA: veja como

15:30
NOVO AGENTE no CHATGPT: DEEP RESEARCH É BRUTAL 🤯
16:24
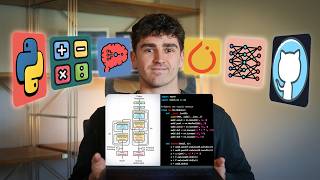
Como eu aprenderia ML em 2025 (se eu pudesse começar de novo)
24:32
A deep-dive into data-wrangling in R (tidyverse)

1:48:50
Oikos Workshop: Data visualization in R using ggplot2

15:12