Oikos Workshop: Data visualization in R using ggplot2

10:33
Stylish Scatter Plot using ggplot2 in R
24:32
A deep-dive into data-wrangling in R (tidyverse)
14:14
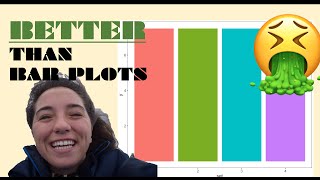
Better than bar plots: Custom point ranges in ggplot2

26:51
ggplot for plots and graphs. An introduction to data visualization using R programming
1:23:40
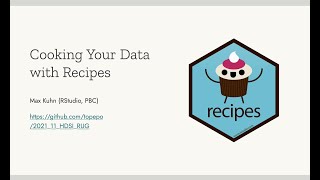
Cooking Your Data with Recipes in R with Max Kuhn

27:14
Transformers (how LLMs work) explained visually | DL5

1:11:15
Intro to Data Visualization with R & ggplot2
17:36