Understanding model interpretability in R with ggplot2 and mikropml (CC134)

26:27
Using ggplot2 to group x-axis discrete values into subgroups (CC133)

30:10
Introduction to building machine learning models in R with mikropml (CC124)
54:44
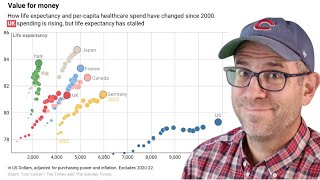
Using ggplot2 to visualize relationship between life expectancy and health spending in R (CC338)

12:20
Don’t Ignore Interactions - Unleash the Full Power of Models with {emmeans} R-package

29:56
Plotting a dilution series using ggplot2 in R with geom_jitter and stat_summary (CC324)

1:03:44
Visualizing Regression Models in R

10:18
Make Beautiful Graphs in R: 5 Quick Ways to Improve ggplot2 Graphs

16:17