Using ggplot2 to visualize relationship between life expectancy and health spending in R (CC338)

36:28
Usando gganimate para animar mudanças na expectativa de vida e gastos com saúde com R (CC339)
52:55
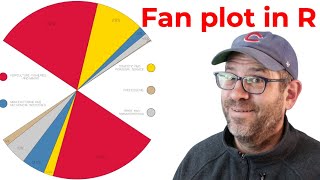
How to recreate WEB DuBois's fan plot from the 1900 Paris Exposition using R and ggplot2 (CC342)

49:32
Visualizing changes in kindergarten vaccination rates with dplyr and ggplot2 in R (CC336)

3:50:19
Data Analytics for Beginners | Data Analytics Training | Data Analytics Course | Intellipaat

1:18:41
Slow Blues & Whiskey 🍷 – Best Relaxing Blues Guitar Songs for Late Night & Chill Mood
24:52
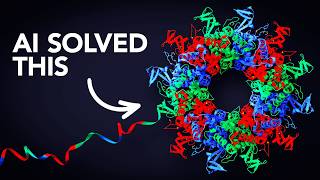
The Most Useful Thing AI Has Ever Done

2:25:06
Italian Baroque – Scarlatti Edition

5:27