How to interpret the results of proteomics data analysis? Proteomics Data interpretation
4:22
Gene ID not recognized problem: Gene ontology enrichment analysis using GO shiny tool

17:21
How to interpret the results of KEGG pathway analysis?
10:59
MS-based proteomics: A short introduction to the core concepts of proteomics and mass spectrometry

21:39
Beginner's Guide to Gene Expression Analysis: Bioinformatics Simplified

23:00
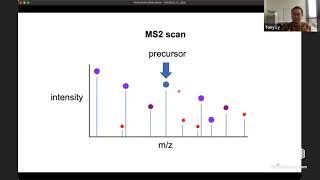
Mass spectrometry for proteomics - part one

50:39
BroadE: Interpretation and automated analysis of proteomic data
56:29
Part 1: Metabolomics Data Analysis
1:04:18