How to interpret the results of proteomics data analysis? Proteomics Data interpretation
4:22
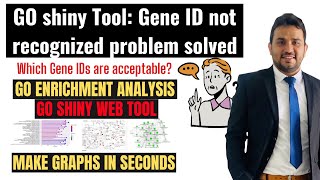
Gene ID not recognized problem: Gene ontology enrichment analysis using GO shiny tool

2:50:52
Introduction into data analysis for mass spectrometry-based proteomics - Lecture by Lennart Martens

50:39
BroadE: Interpretation and automated analysis of proteomic data

17:21
How to interpret the results of KEGG pathway analysis?

7:42
How to draw a principal component analysis (PCA) plot easily?

45:29
Types of Statistical Processing for Proteomics Data | 2023 EMSL Summer School, Day 3
10:59
MS-based proteomics: A short introduction to the core concepts of proteomics and mass spectrometry

59:26