Error Bars using R programming
5:16
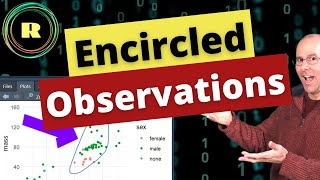
Encircled observations - use ggplot and ggalt to create great plots and data visualization.

26:51
ggplot for plots and graphs. An introduction to data visualization using R programming

34:14
Creating bar plot with error bars using ggplot2's stat_summary in R (CC318)

25:39
Explore your data using R programming

22:31
Barplot using R with error bar, Data Visualization, GGplot2, Plotting data ranking

2:59:44
Best of Tchaikovsky - Classical Music Gems

6:39
How to Interpret Error Bars

22:18