Encircled observations - use ggplot and ggalt to create great plots and data visualization.

4:28
Use pivot_wider() to shape your data. R programming from beginners.

7:37
Advanced ggplot - using facets
10:53
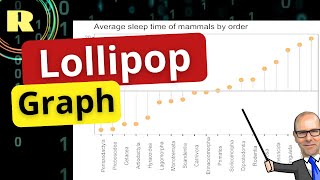
Lollipop Graph using ggplot.

28:46
How I make beautiful GRAPHS and PLOTS using LaTeX
20:16
A step-by-step guide to parameterized reporting in R using Quarto

17:26
Using ggplot to create bar charts for 2 categorical variables. R programming for beginners.

1:07:00
Sezen Aksu En Sevilen Şarkıları (1 Saat)

50:42