How to Interpret a Volcano Plot
11:38
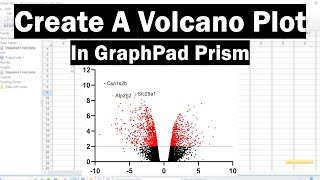
How To Create A Volcano Plot In GraphPad Prism

6:01
Volcano plots explained | How to interpret a volcano plot for DGE

11:38
How to interpret GSEA results and plot - simple explanation of ES, NES, leading edge and more!

8:54
Germany’s Far-Right Comeback | NYT Opinion

10:56
Principal Component Analysis (PCA) - easy and practical explanation

13:26
How to calculate fold change FC, log2FC, Pvalue, Padj, Up and down regulated genes

25:32
DESeq2 Basics Explained | Differential Gene Expression Analysis | Bioinformatics 101

18:24