How to calculate fold change FC, log2FC, Pvalue, Padj, Up and down regulated genes
9:19
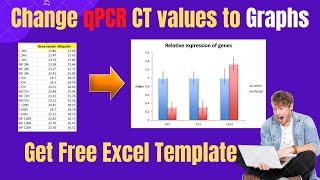
Change CT values of qPCR data into Relative expression Graphs

10:16
How to find genes of interest in RNA-seq / transcriptomic data ? Kegg pathway

7:34
YouTube guidelines and training videos with Paul Howe

12:44
How to calculate log2fold change / p value / how to use t test in excel
57:35
How to analyze RNA-Seq data? Find differentially expressed genes in your research.

43:00
Excel AI Tools: built-in AI technology in Excel| Excel Tutorial Expert Level | IPT Excel Excel

38:44
Transcriptomic | RNA seq data Interpretation | DEGs | GO | KEGG

14:15