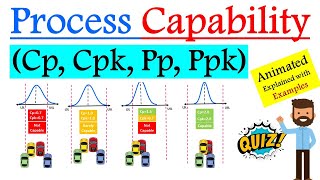
PROCESS CAPABILITY: Explaining Cp, Cpk, Pp, Ppk and HOW TO INTERPRET THOSE RESULTS

5:47
How to Calculate Variance and Standard Deviation

16:04
The 7 Quality Control (QC) Tools Explained with an Example!
11:54
What is Process Capability Cp Cpk ? | Explaining Cp, Cpk, Pp, Ppk with Animated Examples

14:53
Cpk - Why 1.33/1.67 or 2.0
19:28
Gauge R&R Fully Explained!! (Measurement System Analysis) Part 1

25:29
SPC - statystyczne sterowanie procesem dla początkujących [podcast szkoła jakości 90]

12:16
CONTROL CHART BASICS and the X-BAR AND R CHART +++++ EXAMPLE

11:48