Intro to Data Visualization in Python with Matplotlib! (line graph, bar chart, title, labels, size)

1:01:31
Python Plotting Tutorial w/ Matplotlib & Pandas (Line Graph, Histogram, Pie Chart, Box & Whiskers)

1:48:25
Python Matplotlib Tutorial for Beginners | Learn in 2 hours | Data Science & Analysis | Amit Thinks

10:22
Python in Excel: 1-minute Hacks You Can Use Today
20:33
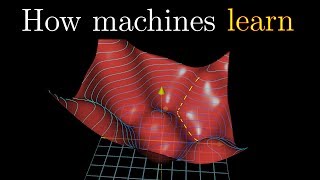
Gradient descent, how neural networks learn | DL2

1:02:41
Matplotlib Full Python Course - Data Science Fundamentals

32:13
Exploratory Data Analysis in Pandas | Python Pandas Tutorials
24:38
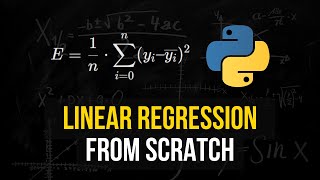
Linear Regression From Scratch in Python (Mathematical)

3:15:53