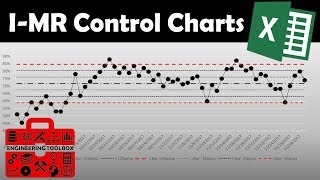
I-MR Control Chart: Detailed illustration with Practical Example

7:12
Xbar-R and Xbar-s chart: Detailed illustration with Practical Examples

20:41
Part 1- Control Charts: X-bar chart, R-chart, & I-MR chart | Statistical Process Control

8:02
P Chart and U Chart (Attribute Control charts)
8:59
Unlock the Power of ImR (XmR) Control Charts - SPC with Excel

6:16
Run Chart With Example (PART-1) : Detailed illustration In Minitab

8:57
Process Capability Study in Minitab (Normal Capability): Illustration with Practical Example
7:32
Learn how to create IMR Control Chart in Minitab

11:42