How to interpret a sieve analysis

23:12
Sieve Analysis & Particle Gradation Curve (Excel Sheet) | Geotech with Naqeeb

14:48
Particle Size Distribution Curve ,Sieve analysis test

58:11
Day-5 session-3 Advanced Optimization Techniques using MATLAB

30:04
ANOVA (Analysis of Variance) Analysis – FULLY EXPLAINED!!!

7:40
Sieve Analysis
21:38
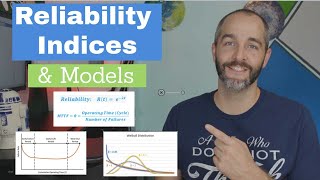
RELIABILITY Explained! Failure Rate, MTTF, MTBF, Bathtub Curve, Exponential and Weibull Distribution

5:51
Standard Method for Sieve Analysis of Fine and Coarse Aggregates (ASTM C136)

15:09