How To Create Interactive Maps with R | Step-By-Step Tutorial

25:41
How to Create 5 MUST-KNOW CHARTS with ggplot2 | Step-by-Step Tutorial

12:21
R Maps: Beautiful Interactive Choropleth & Scatter Maps with Plotly
12:42
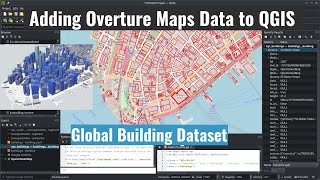
Adding Overture Maps Data (Global Building Dataset) to QGIS

45:31
How to Get Data From APIs with R & {httr2} | Ultimate Step-By-Step Tutorial

20:16
A step-by-step guide to parameterized reporting in R using Quarto
8:19
5 Levels of Data Cleaning Every R User Must Master (Beginner to Pro in 5 Steps)
17:09
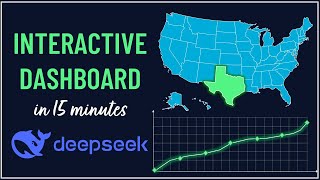
How to Build an Interactive Dashboard with DeepSeek R1

27:48