How to Choose the Right Chart for Your Data | #Tableau Course #136

18:15
Tableau Relationships: Fast and Flexible Way to Connect Tables | #Tableau Course #36
26:34
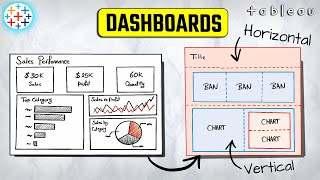
Mastering Tableau Dashboards: Layout Containers Explained | #Tableau Course #137

13:41
Telling a Story with Data | Dashboard Build Demo

25:57
Data Visualization Crash Course | Consulting Best Practices

19:01
My Indexing Strategy for Every SQL Project | Indexing Best Practices | #SQL Course #27

17:11
🚨 YOU'RE VISUALIZING YOUR DATA WRONG. And Here's Why...

1:02:41
Matplotlib Full Python Course - Data Science Fundamentals

45:54