Histogram (PART-2) : Different shapes of Histogram and its interpretation (Meaning)

7:38
Histogram With Example: Detailed illustration In Excel and Minitab_1

9:50
Correlation and Regression Analysis: Learn Everything With Examples

12:18
Normal distribution and histogram explained | What is a bell curve

12:02
Process Capability Analysis: All Concepts | Simplest Way To Learn Capability Analysis
5:21
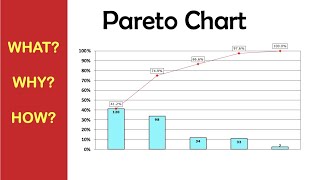
Pareto Chart // What is it? When and How to use it?

21:57
Process Capability Analysis | Application of Statistical Methods in Manufacturing

12:33
How to Create a Histogram with Normal curve overlay in Excel,Add normal curve, insert bell curve to

11:23