Get more out of a MATRIX VISUAL in Power BI | Turning a matrix into a GANTT CHART

16:29
PROJECT MANAGEMENT in Power BI? Create a GANTT CHART from a bar chart | NO CUSTOM VISUAL solution

20:45
Visualizing Status Tracking Data in Power BI
7:36
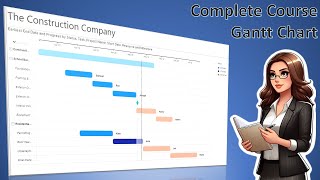
Gantt Chart in Power BI: Complete Guide #tutorial #ganttchart #powerbi #projectmanagement
15:01
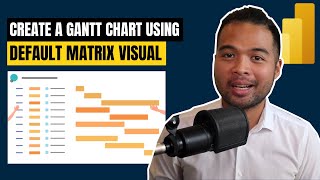
How to create a GANTT CHART to track project and tasks in Power BI using the default Matrix Visual
8:50
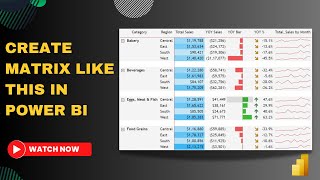
Transform Boring Matrix into Beautiful Visual in Power BI | Easy Tips & Tricks | MiTutorials

16:14
PUSH the limits of Power BI native VISUALS and CAPTIVATE your audience | TIMELINE chart Step-by-Step
12:35
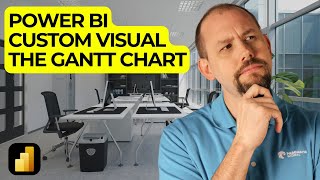
Discover the POWER of Power BI Custom Visual Gantt Chart

11:35