Finding Outliers & Modified Boxplots 1.5(IQR) Rule

4:23
Outliers - Box and Whisker Plot (1.5 IQR)

6:22
How to Make a Boxplot with Outliers
12:33
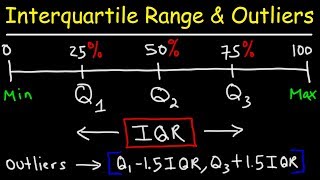
How To Find The Interquartile Range & any Outliers - Descriptive Statistics

13:56
How To Make Box and Whisker Plots
47:50
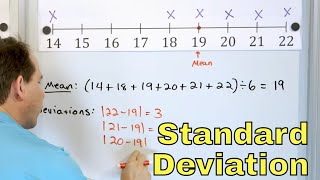
Standard Deviation & Mean Absolute Deviation Explained - 6-8-19]

28:46
How I make beautiful GRAPHS and PLOTS using LaTeX

19:55
Understand Box Plots in Statistics (Box-and-Whisker Plots) - [6-8-23]

8:17