Comparing duckdb and duckplyr to tibbles, data.tables, and data.frames (CC279)

32:28
Renaming our R package, updating RStudio and R, organizing code, and passing Check! (CC280)

58:29
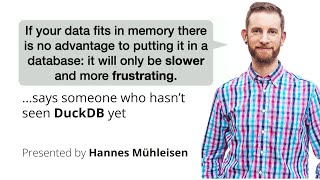
Hannes Mühleisen - Data Wrangling [for Python or R] Like a Boss With DuckDB
52:55
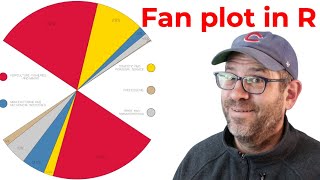
How to recreate WEB DuBois's fan plot from the 1900 Paris Exposition using R and ggplot2 (CC342)
54:44
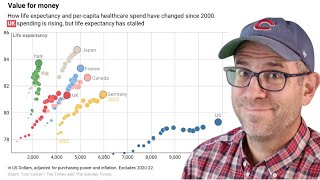
Using ggplot2 to visualize relationship between life expectancy and health spending in R (CC338)
28:52
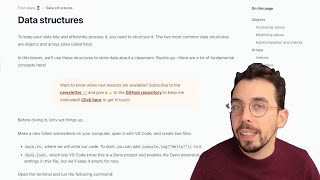
First steps - Data stuctures in TypeScript
25:47
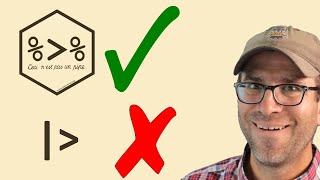
The magrittr and base R pipe: what's the difference? (CC241)
25:58
Big Data is Dead | MotherDuck
19:02