bqplot Seamless Interactive Visualizations and Dashboards in the Jupyter Notebook | SciPy 2018

25:31
Bringing ipywidgets Support to plotly.py | SciPy 2018 | Jon Mease

29:25
Dashboarding with Jupyter Notebooks, Voila and Widgets | SciPy 2019 | M. Breddels and M. Renou

26:56
PyViz Unifying Python Tools for In Browser Data Visualization | SciPy 2018

25:25
scikit learn and Tabular Data Closing the Gap | SciPy 2018 | Joris Van den Bossche

30:44
Turn any Notebook into a Deployable Dashboard | SciPy 2019 | James Bednar
25:17
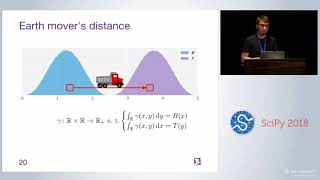
Detecting Anomalies Using Statistical Distances | SciPy 2018 | Charles Masson

23:36
I Practice Thinking in English🔥 Speaking English Practice⭐️Improve English🔥Graded Reader🔥Grammar✅️
2:07:00