Box-Plot (Simply explained and create online)
7:35
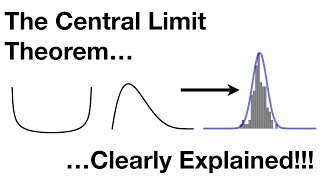
The Central Limit Theorem, Clearly Explained!!!
7:50
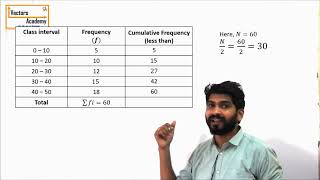
Statistics - Mean, Median & Mode for a grouped frequency data

19:55
Understand Box Plots in Statistics (Box-and-Whisker Plots) - [6-8-23]
4:15:27
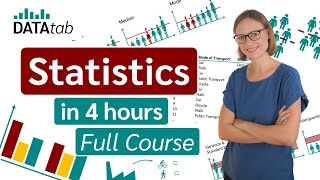
Statistics - A Full Lecture to learn Data Science

13:56
How To Make Box and Whisker Plots

1:07:00
Sezen Aksu En Sevilen Şarkıları (1 Saat)

10:09
Forest Plot Interpretation - Clearly Explained

4:55:09