Tableau Charts: Bar Charts | #Tableau Course #104

2:21
Tableau Charts: Bar-in-Bar Chart | #Tableau Course #105

10:06
11 insert objects ver 2 Creating a Function

38:32
PART 9 - WHAT IS LOOP AND HOW TO CREATE DIFFERENT METHOD IN EXCEL VBA MACRO (TAMIL) | Kallanai YT

43:53
Sales Dashboard in Excel | Dynamic Excel Dashboard for Sales

4:19
sql commands | ddl dml dcl tcl commands in sql with examples

8:22
Create A Map with Multiple Layers in Tableau
29:58
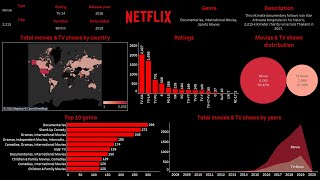
Create Netflix dashboard with Tableau in 30 minutes

5:00