How to Make a Tornado Chart in Excel (Sensitivity Analysis)
14:37
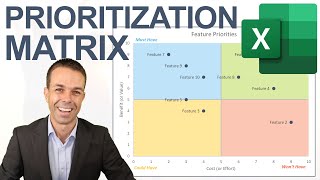
How to Make a Prioritization Matrix in Excel (Colored Quadrants)

14:08
How to Make a Kano Analysis Chart in Excel (Product satisfaction over its lifetime)

28:16
Data-Driven Growth & Climate Tech: Insights from a Fractional Growth Officer | Sarah O'Sell

13:14
Sensitivity Analysis using Tornado Diagrams

5:12
Como fazer um gráfico de tornado no Excel

11:20
How to Make Root Cause Analysis in Excel (Cell-based Fishbone or Ishikawa)
15:31
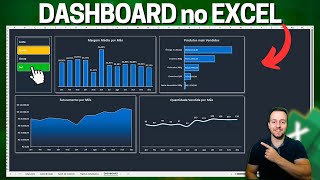
Como Fazer Dashboard Moderno e Bonito no Excel em 15 minutos | Grátis p/ Download

9:34