How to create a heatmap in R with geom_tile and geom_text from ggplot2 (CC105)

27:09
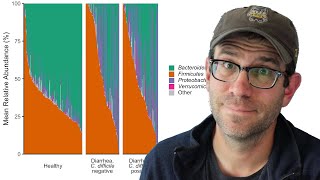
Creating a pie chart in R with ggplot2 using microbiome data ... and why you shouldn't (CC104)

9:02
Como fazer um Heatmap no software R Studio

25:16
How to create a grouped plot of jittered data with the ggplot2 R package (CC108)
52:55
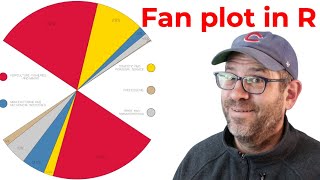
How to recreate WEB DuBois's fan plot from the 1900 Paris Exposition using R and ggplot2 (CC342)

24:57
Step-by-step heatmap tutorial in R with pheatmap()

49:32
Visualizing changes in kindergarten vaccination rates with dplyr and ggplot2 in R (CC336)
23:45
Grouped stacked barchart for individuals using ggplot2 with geom_col and facet_grid (CC106)

18:46