Example: Supply and Demand

4:34
Brainstorming: Using Average Rate of Change to Identify Linear Functions

21:51
Supply, Demand and Equilibrium Test
13:38
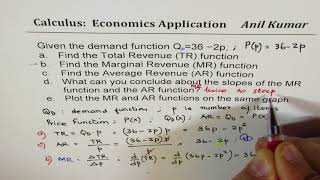
Demand Function Q = 36 - 2p Plot Marginal and Average Revenue Imperfect Market

20:35
Economics Tutorial: Calculating Elasticity of Demand and Supply

6:29
Supply and Demand Equations Introduction

6:08
Como calcular o equilíbrio de mercado. (SEM GRÁFICOS) | Pense Económico

41:24
2. Preferences and Utility Functions

15:18