Double group on x axis with ggplot

7:37
Advanced ggplot - using facets

18:11
Visualize your data using ggplot. R programming is the best platform for creating plots and graphs.

16:26
L'IA Crée une APP de A à Z en 15 MINUTES!
1:44:53
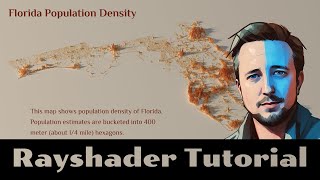
Rayshader Tutorial—Florida Population Density

10:18
Make Beautiful Graphs in R: 5 Quick Ways to Improve ggplot2 Graphs

29:17
Learn to plot Data Using R and GGplot2: Import, manipulate , graph and customize the plot, graph

42:13
Por 33.000 euros, esperaria que fosse perfeito

19:00