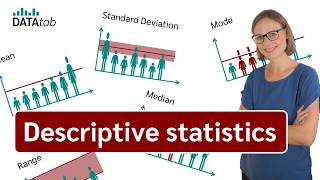
Descriptive statistics and data visualisation. An introduction to statistics and working with data

12:50
Statistics made easy ! ! ! Learn about the t-test, the chi square test, the p value and more

26:51
ggplot for plots and graphs. An introduction to data visualization using R programming
13:14
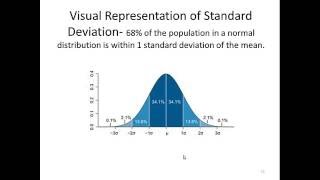
Introduction to Descriptive Statistics

7:09
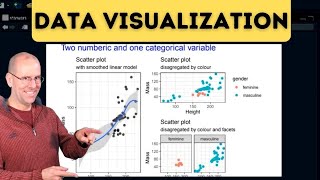
Science of Data Visualization | Bar, scatter plot, line, histograms, pie, box plots, bubble chart
11:10
Descriptive Statistics [Simply explained]

25:57
Curso intensivo de visualização de dados

15:07
T-test, ANOVA and Chi Squared test made easy.
11:43