Control System Lectures - Bode Plots, Introduction

8:23
Bode Plots by Hand: Real Constants

13:54
Gain and Phase Margins Explained!

13:53
Bode Plots Explained
7:44
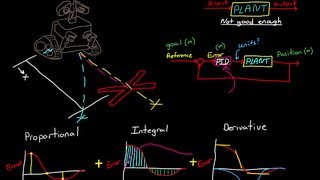
PID Control - A brief introduction

16:43
A quick introduction to frequency response

17:51
Nichols Chart, Nyquist Plot, and Bode Plot | Control Systems in Practice

10:19
Control Systems Lectures - Time and Frequency Domain

16:42