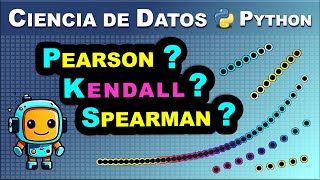
Cómo Calcular Correlaciones en Python: Guía Completa en 7 Pasos [Pearson, Kendall, Spearman]

30:04
7. Cómo Agrupar Datos en Python con GroupBy: Tutorial Completo con Pandas
16:56
¿Qué tipo de Correlación debo utilizar: Pearson, Spearman o Kendall?: Diferencias y Similitudes

20:07
Como crear Histogramas en Python [GUIA COMPLETA]

20:00
📈 Prueba de Hipótesis de Correlación: ¿R de Pearson o Rho de Spearman? 📊

30:47
Regresión Lineal Simple con Análisis de Datos y Minitab

25:19
✅ CORRELACIÓN r de PEARSON #1: Interpretación ✅ LatinTest

1:48:40
Música para Estudar - Aumentar Concentração, Foco e Memória
13:54