Bar chart makeover in Power BI

13:37
KPI Visual Ideas in Power BI

15:34
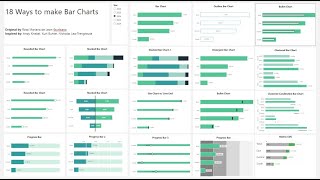
MASTERING Bar Charts in Power BI | No more Cut Labels
21:52
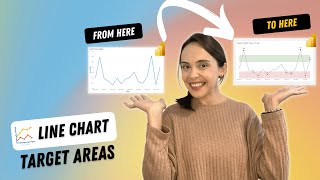
Power BI Viz Tricks - Line chart target areas
54:29
Tutoriel sur les graphiques à barres Power BI de A à Z | Guide étape par étape
8:03
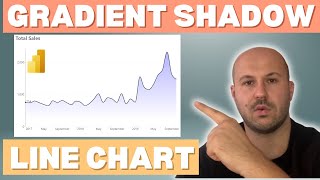
How to Create Line Chart with Gradient Shadow in Power BI

15:42
How to show OVERLAPPING BAR CHARTS in Power BI // Show and Compare Variance

9:43
Transforming a table into a fancy bar chart - Power BI

13:17