Using the F-Distribution Tables in Statistics

20:23
Lesson 1 - What is the F-Distribution in Statistics?

21:10
One Way ANOVA

51:03
Standard Normal Distribution Tables, Z Scores, Probability & Empirical Rule - Stats
22:42
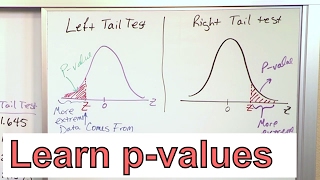
Calculate the P-Value in Statistics - Formula to Find the P-Value in Hypothesis Testing

19:54
How To Know Which Statistical Test To Use For Hypothesis Testing

9:05
Using the F Table to Find Areas and Percentiles

8:15
F-Test for two sample variances

19:41