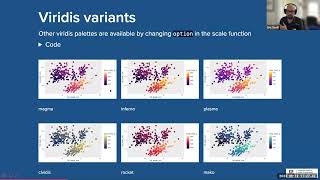
Top tips to create pretty plots in R (ggplot2)
42:22
COMPLETE SURVIVAL ANALYSIS tutorial in R: Kaplan-Meier, Cox regression, Forest Plots...
16:29
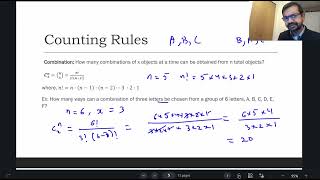
Business Stats 03: Probability Part 1: Basic Definitions

29:17
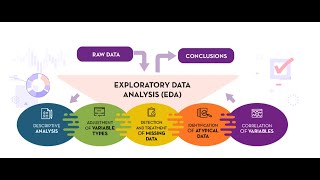
Learn to plot Data Using R and GGplot2: Import, manipulate , graph and customize the plot, graph
1:23:51
Summer Workshop Series: Crafting Publication Quality Data Visualizations With ggplot2

26:51
ggplot for plots and graphs. An introduction to data visualization using R programming
23:33
Machine Learning – Linear Regression and Random Forest Regressor

24:56
Gene Set Enrichment Analysis (GSEA) with fgsea - easy R tutorial

15:39