Mosaic plots and segmented bar charts | Exploring two-variable data | AP Statistics | Khan Academy

12:46
Bar Charts and Pie Charts for Categorical Data | Statistics
12:22
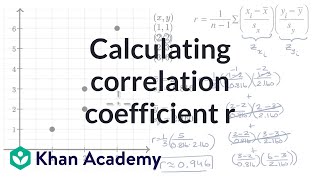
Calculating correlation coefficient r | AP Statistics | Khan Academy

7:21
How to create a histogram | Data and statistics | 6th grade | Khan Academy

9:34
Density Curves | Modeling data distributions | AP Statistics | Khan Academy

7:35
Bar Charts, Pie Charts, Histograms, Stemplots, Timeplots (1.2)

7:43
Interpreting box plots | Data and statistics | 6th grade | Khan Academy

37:39
Statistics 101: Introduction to the Chi-square Test

14:25