Info-graphics: Group of Circle Charts in Excel

18:49
Dynamic Variance Arrows Chart with Check Boxes

15:11
Spotlight Visualization in Excel (Part-1) | Dynamic RAG (Red, Amber, and Green) Stoplights
26:14
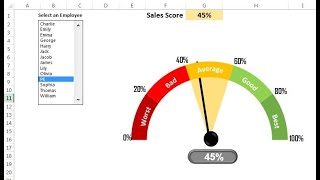
Dynamic Sales Score Meter Chart with Form Control Combo box and List box
10:48
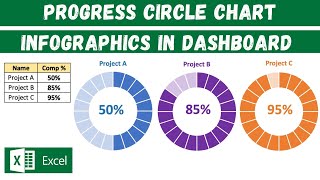
Progress Circle Chart Infographics in Excel Dashboard

8:59
Best way to create the Sales & Margin Growth Chart in Excel (4 charts combined into 1 chart)
12:53
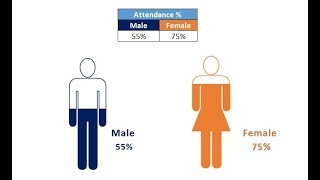
Male and Female Info-graphics in Excel

26:29
Pivot Table with Progress Chart and Dashboard

15:41