How to read a box plot (a.k.a. a box-and-whisker plot) - Nick Desbarats

19:55
Understand Box Plots in Statistics (Box-and-Whisker Plots) - [6-8-23]

19:03
Why Your Report Needs a BOX PLOT and How to Build It in Power BI

1:10:35
Practical Charts Course - Introductory Section
17:35
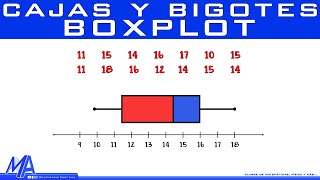
Diagrama de cajas y bigotes | Boxplot

4:58
Understanding & Comparing Boxplots (Box and Whisker Plots)

17:11
🚨 YOU'RE VISUALIZING YOUR DATA WRONG. And Here's Why...

14:16
Practical Charts Course Preview

10:22