How to add annotations to ggplots in R

11:37
Graphing Functions in R using ggplot()

15:39
Understand annotate() to improve your plots | A ggplot2 Tutorial

18:39
Graphics in R with ggplot()

7:53
Titles and Annotations with ggplot
6:31
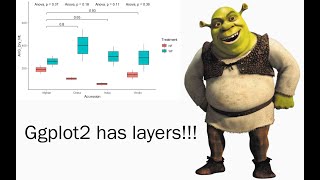
Ggplot2 is a lot like Shrek! (grouped boxplot tutorial with pairwise comparisons)

12:24
ANOVA in R

11:26
Introduction to the plotly Package in R (Example) | Draw Interactive Plots | Create Web-Based Graphs

28:05