Highlighting a data point and comparing all others in a distribution

20:37
Filter columns, not tables, in DAX
21:45
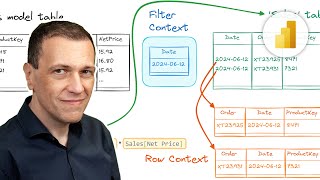
Row context in DAX explained visually

5:38
Becoming a Data Analyst in 2025 - STILL Worth It?

25:49
Use scatterplots to find details in Power BI reports

17:05
Comparing cumulative metrics for events with different start dates

9:36
‘Why in God’s name should Trump get a thank you?’: Fmr. Russia ambassador shreds Vance over Ukraine

26:36
When are variables evaluated in DAX

13:59