Data Visualization Thought Process // Python Matplotlib Baby Names Data Visualization

15:16
Seaborn boxplot | Box plot explanation, box plot demo, and how to make a box plot in Python seaborn

32:33
Intro to Data Visualization in Python with Matplotlib! (line graph, bar chart, title, labels, size)
15:46
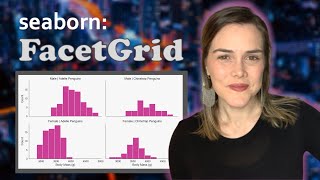
Seaborn FacetGrid | How to make Small Multiples with Python Seaborn | Titles, Hue, Legend

14:02
Le discours d'adieu de Justin Trudeau aux militants libéraux (en français)

15:40
Seaborn ecdfplot | What is an ECDF plot? And how to code an ECDF plot in Python seaborn

3:50:19
Data Analytics for Beginners | Data Analytics Training | Data Analytics Course | Intellipaat

14:39
Seaborn JointGrid | Understanding the jointplot vs jointgrid and the seaborn jointgrid axis

17:29