Add any Plot to your {gt} table

17:12
Understand fct_reorder() to SORT ANY Chart Element | A ggplot2 Tutorial

45:58
Making high-quality tables in R with the gt package: a conversation with Tom Mock

27:48
How To Create Interactive Tables With R & reactable | Step-By-Step Guide

18:11
Visualize your data using ggplot. R programming is the best platform for creating plots and graphs.

20:22
How to make a thousand plots look good

7:52
How to Make Awesome Statistical Plots | ggstatsplot
11:13
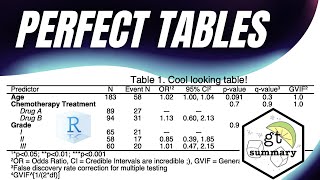
PERFECT TABLES IN #R ! 💪 {gtsummary}

52:18