How to perform a QTL analysis using the qtl package in R and plot the results (2 or more phenotypes)

27:43
How to use the mark-recapture program Mark under R (by using the RMark package)

24:17
How to use GIS in R

22:22
Polygenic risk scores

43:35
QTL mapping and GWAS (Bioinformatics S8E2)

39:37
Master Missing Data Like a Pro! MICE Imputation & Visualization in R (Step-by-Step Guide)
26:17
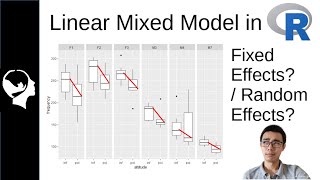
(Simplified) Linear Mixed Model in R with lme()

2:42:17
Deep House Mix 2024 | Deep House, Vocal House, Nu Disco, Chillout Mix by Diamond #3

19:02