How To Add Error Bars In Excel (Custom Error Bars)

11:34
How to Add Error Bars of Standard Deviation in Excel Graphs (Column or Bar Graph)

7:56
How To Add Error Bars In Excel Scatter Plot (Custom Error Bars)

15:25
Creating publication quality bar graph (with individual data points) in excel

13:08
Advanced Excel - Data Validation and Drop-Down Lists

19:09
Publication Quality Bar Graph in Excel for Research
10:39
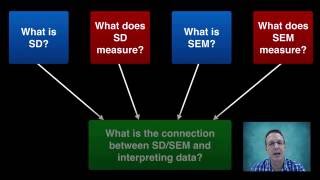
Standard Deviation and Standard Error of the Mean

8:31
How To Perform A One-Way ANOVA Test In Excel

7:05