Create maps using the sf package in R programming
21:26
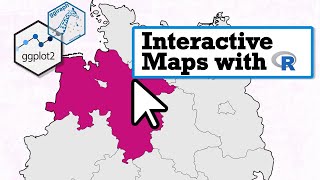
How To Create Interactive Maps with R | Step-By-Step Tutorial

27:31
Clean your data with R. R programming for beginners.

12:21
R Maps: Beautiful Interactive Choropleth & Scatter Maps with Plotly

10:30
R tutorial: Creating Maps and mapping data with ggplot2
20:16
A step-by-step guide to parameterized reporting in R using Quarto

26:51
ggplot for plots and graphs. An introduction to data visualization using R programming

18:11
Visualize your data using ggplot. R programming is the best platform for creating plots and graphs.

15:41