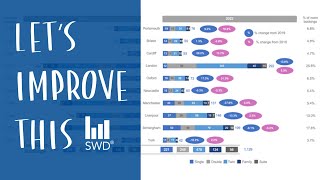
Transform dashboard insights into an action-inspiring story

11:19
Data storyteller improves a COLORFUL SLIDE | EP.2 Where are your eyes drawn?

17:11
🚨 YOU'RE VISUALIZING YOUR DATA WRONG. And Here's Why...

13:41
Telling a Story with Data | Dashboard Build Demo

18:45
Transform this data table - three different scenarios!

6:53
How to read a box plot (a.k.a. a box-and-whisker plot) - Nick Desbarats
11:06
Transform a busy graph into a simple communication | data viz example

16:33
Turning Bad Charts into Compelling Data Stories | Dominic Bohan | TEDxYouth@Singapore
22:23