Tableau Charts: Box Plot | #Tableau Course #130

7:21
How to Create a Dynamic Quadrant Chart in Tableau | #Tableau Course #129

4:14
Box and Whisker in Tableau
26:34
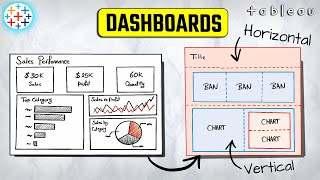
Mastering Tableau Dashboards: Layout Containers Explained | #Tableau Course #137

12:32
How to Choose the Right Chart for Your Data | #Tableau Course #136

19:03
Why Your Report Needs a BOX PLOT and How to Build It in Power BI

6:53
How to read a box plot (a.k.a. a box-and-whisker plot) - Nick Desbarats

45:54
30 SQL Tips and Tricks From 15 Years of Experience | #SQL Course #29

3:51:23