How to Create Your Own Table Theme with the gt Package

7:29
How to Use GitHub Actions with R to Run Code Automatically
15:40
Add any Plot to your {gt} table

19:44
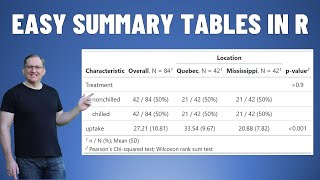
Describe and Summarise your data
21:55
Beautiful tables with the gt package
4:23
How to create a professional regression table in R (5 minutes)
43:36
Cara Thompson on Creating Custom Color Palettes in R
21:38
Publication Ready Summary Tables with the {gtsummary} Package (Daniel Sjoberg, Karissa Whiting)
5:41