Correlation coefficient meta analysis funnel forest plot in R Statistics

12:41
Meta analysis package with functions in R Statistics

2:09:54
Subgroup meta analysis odds risk ratio proportional mean difference correlation in R Statistics

24:02
Proportional meta analysis funnel forest plot in R Statistics
11:23
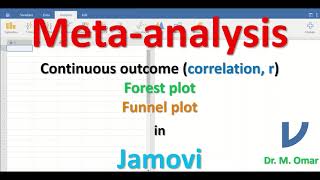
correlation coefficient meta analysis funnel forest plot in JAMOVI

20:43
Funnel Plot in Biostatistics

12:07
Plot Pearson Correlation Coefficient of Multiple Variables|| R Studio
39:55
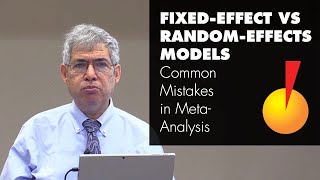
Fixed Effect vs. Random Effects Models - Common Mistakes in Meta-Analysis and How To Avoid Them

1:29:35