Animations in R with gganimate

8:26
Plotly for 3d and interactive plots in R

10:18
Make Beautiful Graphs in R: 5 Quick Ways to Improve ggplot2 Graphs

18:11
Visualize your data using ggplot. R programming is the best platform for creating plots and graphs.

20:16
A step-by-step guide to parameterized reporting in R using Quarto
11:13
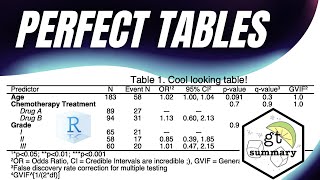
PERFECT TABLES IN #R ! 💪 {gtsummary}

11:48
Making a bar graph in RStudio (ggplot2)

26:51
ggplot for plots and graphs. An introduction to data visualization using R programming

19:00