Advanced ggplot (episode #1)
10:53
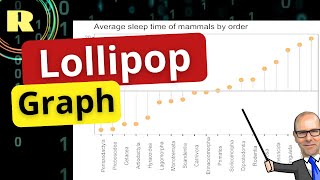
Lollipop Graph using ggplot.

18:11
Visualize your data using ggplot. R programming is the best platform for creating plots and graphs.
10:39
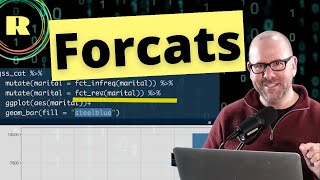
Using R programming to manage categorial variables or factors using the forcats package

10:18
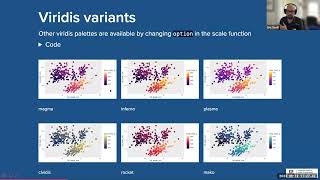
Make Beautiful Graphs in R: 5 Quick Ways to Improve ggplot2 Graphs

26:51
ggplot for plots and graphs. An introduction to data visualization using R programming
21:26
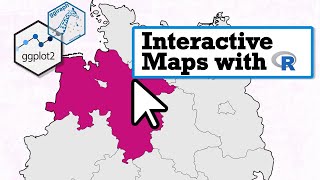
How To Create Interactive Maps with R | Step-By-Step Tutorial

29:17
Learn to plot Data Using R and GGplot2: Import, manipulate , graph and customize the plot, graph
1:23:51