Adding patterns to barplots with ggpattern and ggplot2 in R (CC319)

30:58
Going for simple with ggplot2 and dplyr (CC320)
52:55
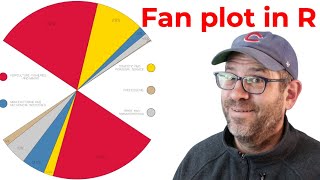
How to recreate WEB DuBois's fan plot from the 1900 Paris Exposition using R and ggplot2 (CC342)

36:50
Adding log-scaled tick marks to an axis with ggplot2 in R (CC325)

8:54
Mastering Mouse Colony Genetics: Preventing Inbreeding with Pedigrees and R

18:22
Bar charts and Histograms using ggplot in R
54:44
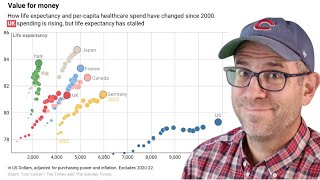
Using ggplot2 to visualize relationship between life expectancy and health spending in R (CC338)

1:14:18
Combining animations of cross country running with ggplot2, gganimate, and magick R packages (CC327)

49:32